Mastering Microsoft® Excel® for Office 365® Level 300
Are you worried you’re using “modern” Excel® like it’s “old-fashioned” Excel? Are you convinced that if you’re not keeping up, you’re falling behind? Microsoft rolls out updates to Excel constantly. How can you keep up? With this new training opportunity, you’ll save countless hours of frustration trying to figure out the powerful advanced features like Power Pivot, Power Query, DAX, Power BI and Power Maps.
For those who don’t have the time to spend at long, dry, multiple-day classroom sessions to learn the essence of modern Excel, this modular approach can show you the most time-saving, cutting-edge features in easy-to-digest chunks or one complete, fascinating day.
Course Outcomes
- Training activities focused on essential Excel tools like PivotTable calculated items, calculated fields and conditional formatting
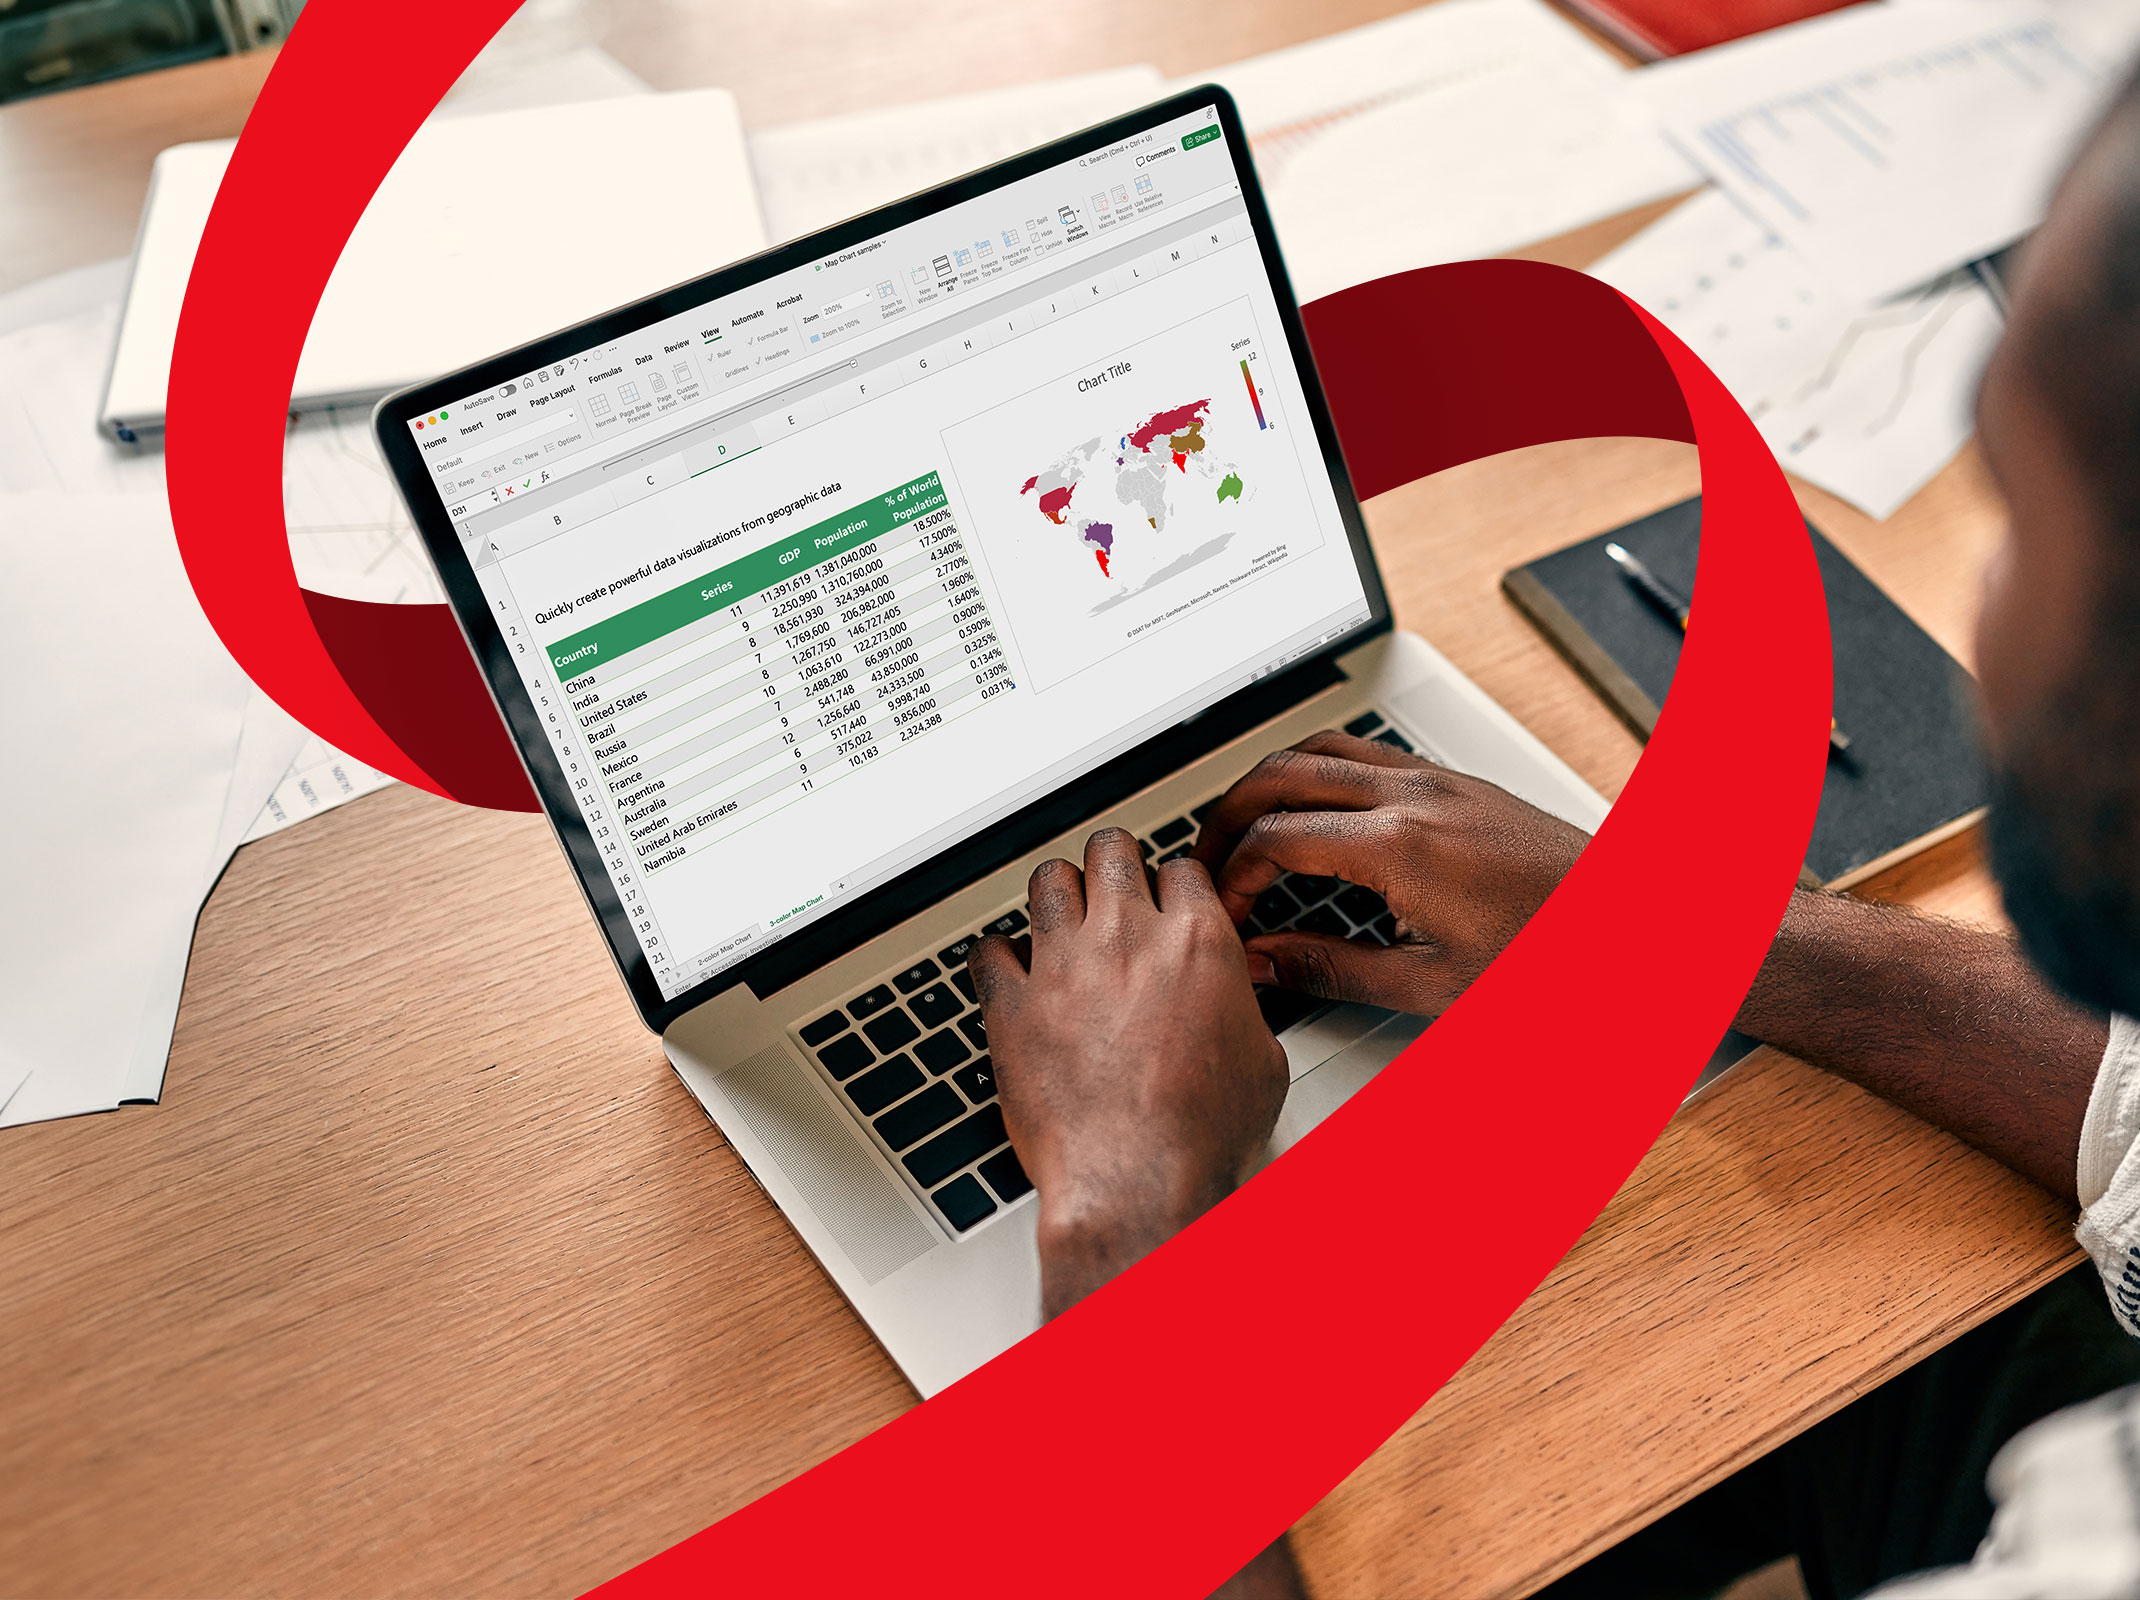
- Hands-on data management using Excel’s collection of Power Tools, such as Power Query, Power Pivot, DAX Functions, Power BI and Power Maps
- Learning resources centered on extracting, transforming and loading data that will be hosted on Power BI dashboards
- Instruction to produce custom-animated 3D map videos for Microsoft PowerPoint presentations
- Adult learning theory approaches to relate Excel features to everyday business needs
Course Agenda


Request group training
Complete the form below to request tailored, private training for your team. We’ll be in touch to discuss your group’s specific goals.
More Courses in
 | skillpath.com/EX300 |
Mastering Microsoft® Excel® for Office 365® Level 300
Are you worried you’re using “modern” Excel® like it’s “old-fashioned” Excel? Are you convinced that if you’re not keeping up, you’re falling behind? Microsoft rolls out updates to Excel constantly. How can you keep up? With this new training opportunity, you’ll save countless hours of frustration trying to figure out the powerful advanced features like Power Pivot, Power Query, DAX, Power BI and Power Maps.
For those who don’t have the time to spend at long, dry, multiple-day classroom sessions to learn the essence of modern Excel, this modular approach can show you the most time-saving, cutting-edge features in easy-to-digest chunks or one complete, fascinating day.
Module 1: Building Advanced PivotTables With Calculated Items and Fields
If you’re not a “pivotologist,” you might be building workbooks and spending too much time on formulas and formatting. In this session, you’ll push the limit of built-in pivots.
- Review Excel® building blocks
- Discuss calculated items and calculated fields
- Discuss conditionally formatting PivotTable fields
- Discuss consolidations
Module 2: Power Query Including the M Language
Do you spend time each month cleaning and transforming data into the right format before you can even begin to pivot it?
- Discuss the fundamentals of Power Query (Get & Transform)
- Clean up your data
- Organize data from many sources
- Merge queries
Module 3: Introduction to Power Pivot — Gathering Data
PivotTables are not designed as data warehouses. Once your datasets run into millions of rows, you’ll need another solution. Business analysts use Power Query to Get & Transform (prepare) data, then they use Power Pivot to build reports.
- Discuss the basics of Power Pivot
- Import data into your model
- Link dimension tables and fact tables
- Build reports
Module 4: Power Pivot DAX Measures
To fully leverage the power of Power Pivot, you must understand and apply a special collection of functions that only work with Power Pivot — known collectively as DAX functions. These functions overcome the limits of standard pivots.
- Discuss what are calculated columns
- Use DAX measures
- Recognize how to use the CALCULATE expression
- Discuss time/date intelligence DAX functions
Module 5: Developing Reports and Dashboards Using Power BI
Power BI is the intersection of Power Query and Power Pivot. Everything you know about Power Query and Power Pivot is the same in Power BI. However, Power BI adds a visual dimension to your data enabling you to display tables, charts and graphs connected to your data source.
- Explain the value of Power BI
- Navigate the Power BI interface
- Recognize how to pull data into Power BI
- Discuss how to begin to build your Power BI dashboard
Module 6: 3D Maps for Excel
Power BI is not the only resource you have for visualizations. Within the sphere of modern Excel features is the dazzling 3D Maps for Excel add-in. With 3D Maps for Excel, you can develop videos that depict a time-phased illustration.
- Discuss the fundamentals of 3D Maps for Excel
- How to build a 3D map and customize its settings
- How to share your map with others
- How to build a 3D map — that’s not from a map: custom mapping
