Jan 05, 2023
Don’t Bring Those Excel Habits When You Visit Power BI
Philip Wiest, Guest Blogger
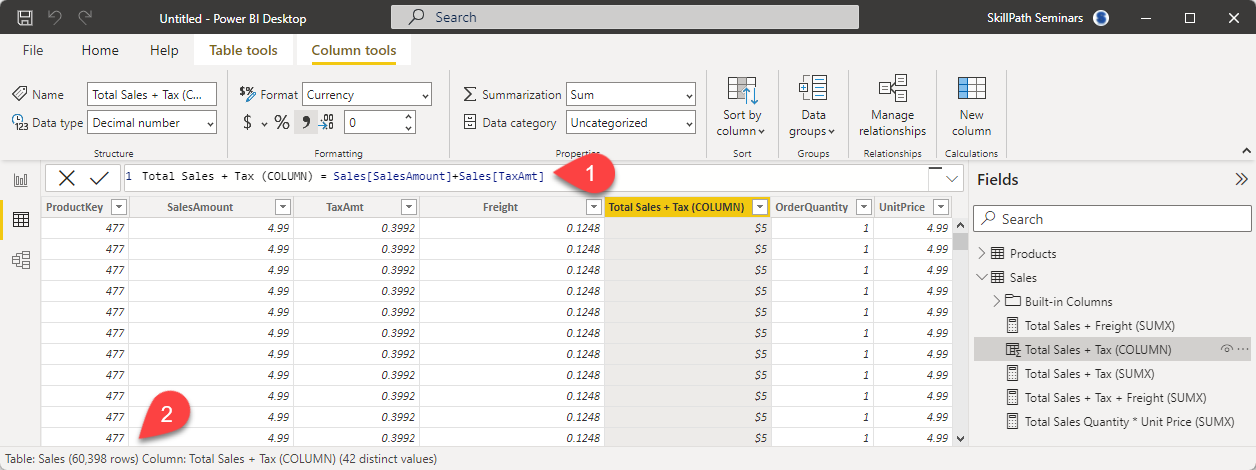
With Power BI you can take a less-than-perfect dataset and produce custom calculated columns.
For example, you can take a Sales Amount and a Tax Amount column and combine them with a formula to generate a Total Sales + Tax Amount.

But that would be bad for two reasons:
- You are unnecessarily expanding your dataset by an extra column and however many rows you have. It could be 60,398 rows!
- You could do this instead by using the SUMX Function to write an “explicit measure” — the non-Excel solution to creating the results you need — Total Sales + Tax.
Backstory
While Excel is built upon a foundation of Excel functions, Power BI calculations rely on DAX (Data Analysis Expressions).
DAX is “wired” to accommodate larger datasets than you can manage with Excel and therefore provides several “power functions” for calculating “row-level” formulas — but in a “one-formula for all” style — rather than a separate calculation for every row of your data set.
SUMX and a calculated column are almost identical in behavior — except a calculated column PERMANENTLY stores the results in the dataset. SUMX does not.
SUMX steps through every row of your table and performs the expression to be evaluated, and then adds the interim results for each row.
The big difference is those interim results are not stored permanently (they are stored in memory) thus making your reporting more efficient.
Building an unnecessary column in Power BI is always a bad move.
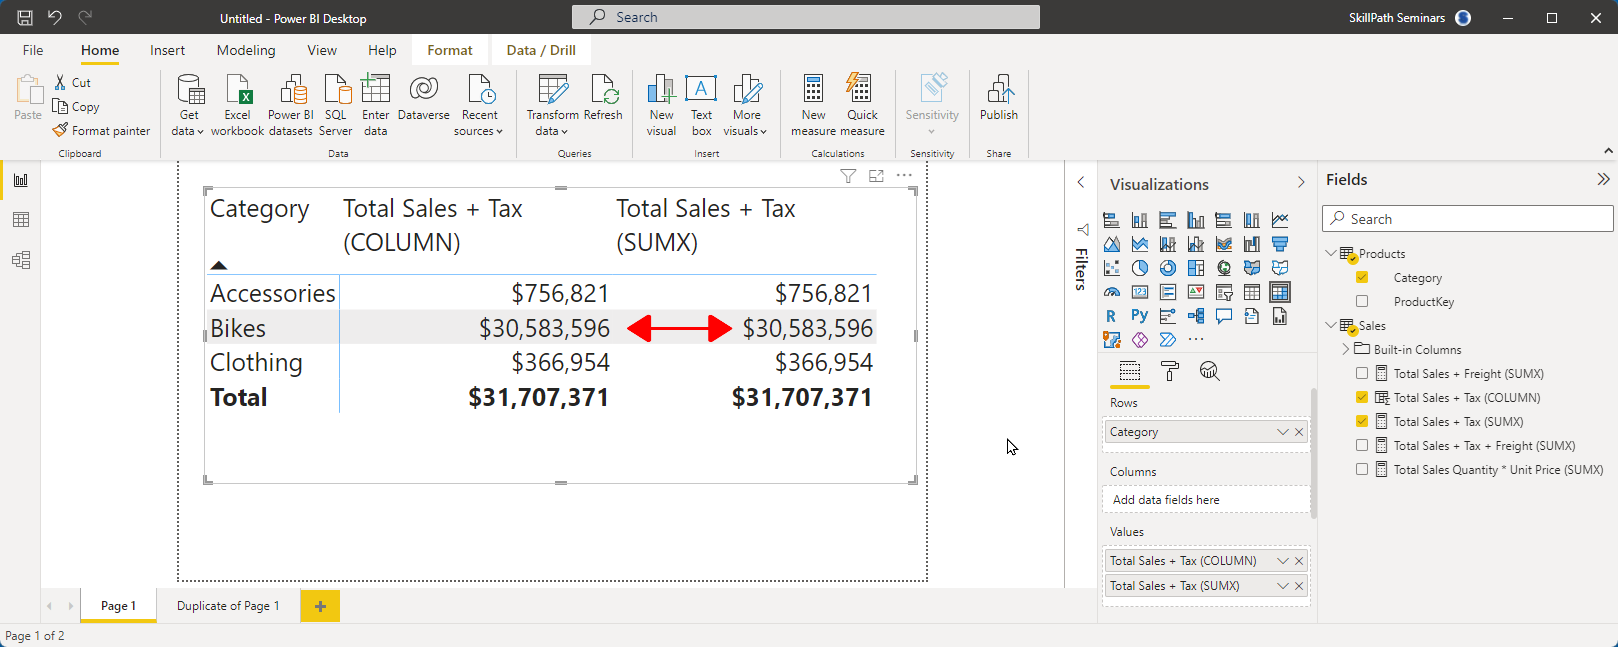
However, because you can’t “see” the row-by-row results, temporarily create both a calculated column and a SUMX measure and compare the results to ensure the SUMX formula is doing the job.
Here’s an example. Compare the two results. They’re identical.
SkillTips:
- The SUMX() function sums the interim results, the AVERAGEX function averages the interim results.
- The second argument and the calculate column need not be a simple formula, it can be any valid formula.
- In Power BI, never import columns that can otherwise be calculated on demand. For example, if you have Units and Price per Unit, you don’t need “Extended Amount in your dataset.”

Loving Power BI? Learn more by registering for a live, online course: Mastering Microsoft Excel Using Power BI.
Let’s Get to It
Let’s create a Sales Amount + Tax Amount Column:

In comparison, let’s create a Sales Amount + Tax Amount Explicit Measure using the DAX SUMX function:

To create a new measure or new column for a table, right-click the table name in the Power BI Fields pane and select New Measure (or new column).
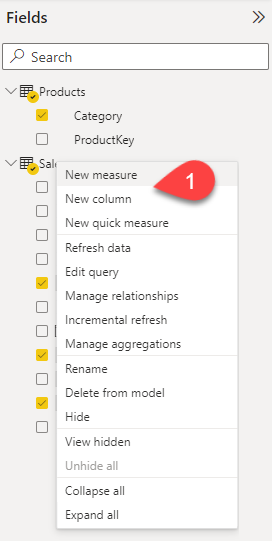
In the formula bar at the top of the Power BI Canvas, type your formula and press Enter.
The Results
When you add your column and measure to a matrix visual, you’ll see identical values, but with that custom column, you will have expanded your dataset unnecessarily.
If the values match, you can remove that unnecessary column from the data model.
And you’ll be on your way to discard those bad Excel habits.
Iterators
SUMX is one of many DAX “iterator” functions - that calculate over every row of a table.
Here are others:
| AVERAGEX | Calculates the average (arithmetic mean) of a set of expressions evaluated over a table. |
| COUNTAX | Counts the number of values which result from evaluating an expression for each row of a table. |
| COUNTX | Counts the number of values which result from evaluating an expression for each row of a table. |
| MAXX | Returns the largest value that results from evaluating an expression for each row of a table. Strings are compared according to alphabetical order. |
| MINX | Returns the smallest value that results from evaluating an expression for each row of a table. Strings are compared according to alphabetical order. |
| PRODUCTX | Returns the product of an expression values in a table. |
| SUMX | Returns the sum of an expression evaluated for each row in a table. |
Power Tip: Organizing Your Custom Columns and Measures
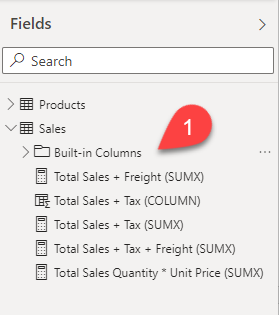
Once you begin building explicit measures, your Field list can get cluttered.
Do you have a cluttered list of table columns, calculated columns, and measures?
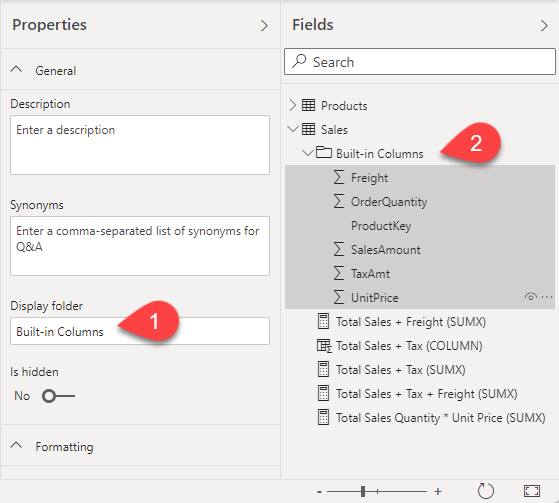
You can assign some of them to a “display folder” (for example, “Built-in Columns”)
In the images in this blog, I’ve already assigned the standard columns to a “Built-in Columns” folder so I can collapse it and “hide” the extra columns.
To build the folder:
- Highlight the Fields in the modeling workspace.
- In the Properties pane, type the name of your “Display Folder”
- Press Enter
Now, when you are building visuals in Power BI, you’ll only see what you need to see — Custom Columns and Measures (like those using SUMX!).
That “SUMS” it up for today!
Philip Wiest
Guest Blogger
Philip Wiest is an expert software trainer, computer analyst and database consultant who knows both the intricacies of computer systems and the ways today’s professionals need to use these essential business tools. Using his experience in Microsoft Excel and Microsoft Office, as well as Windows and the Internet, Phil uses a special mix of tactful guidance and distilled observation so his audiences learn and retain the critical keystrokes, application combinations and creative processes that save time and simplify computer use.
Latest Articles
Article Topics
